|
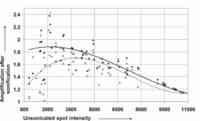
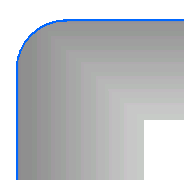
Figure 5
Click to enlarge. Plot of the initial measured spot intensities of 75 assayed spots against the intensity amplification factor after sonication with third degree polynomial fit. Strongest (1.6 to 1.8 times) net signal amplification after 30 min. of sonication was measured for 2000 to 5000 LAU which changed to 600 to 3500 LAU and 1.8 to 1.9 times intensity amplification after 60 min. of sonication.
|
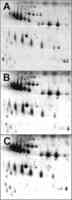
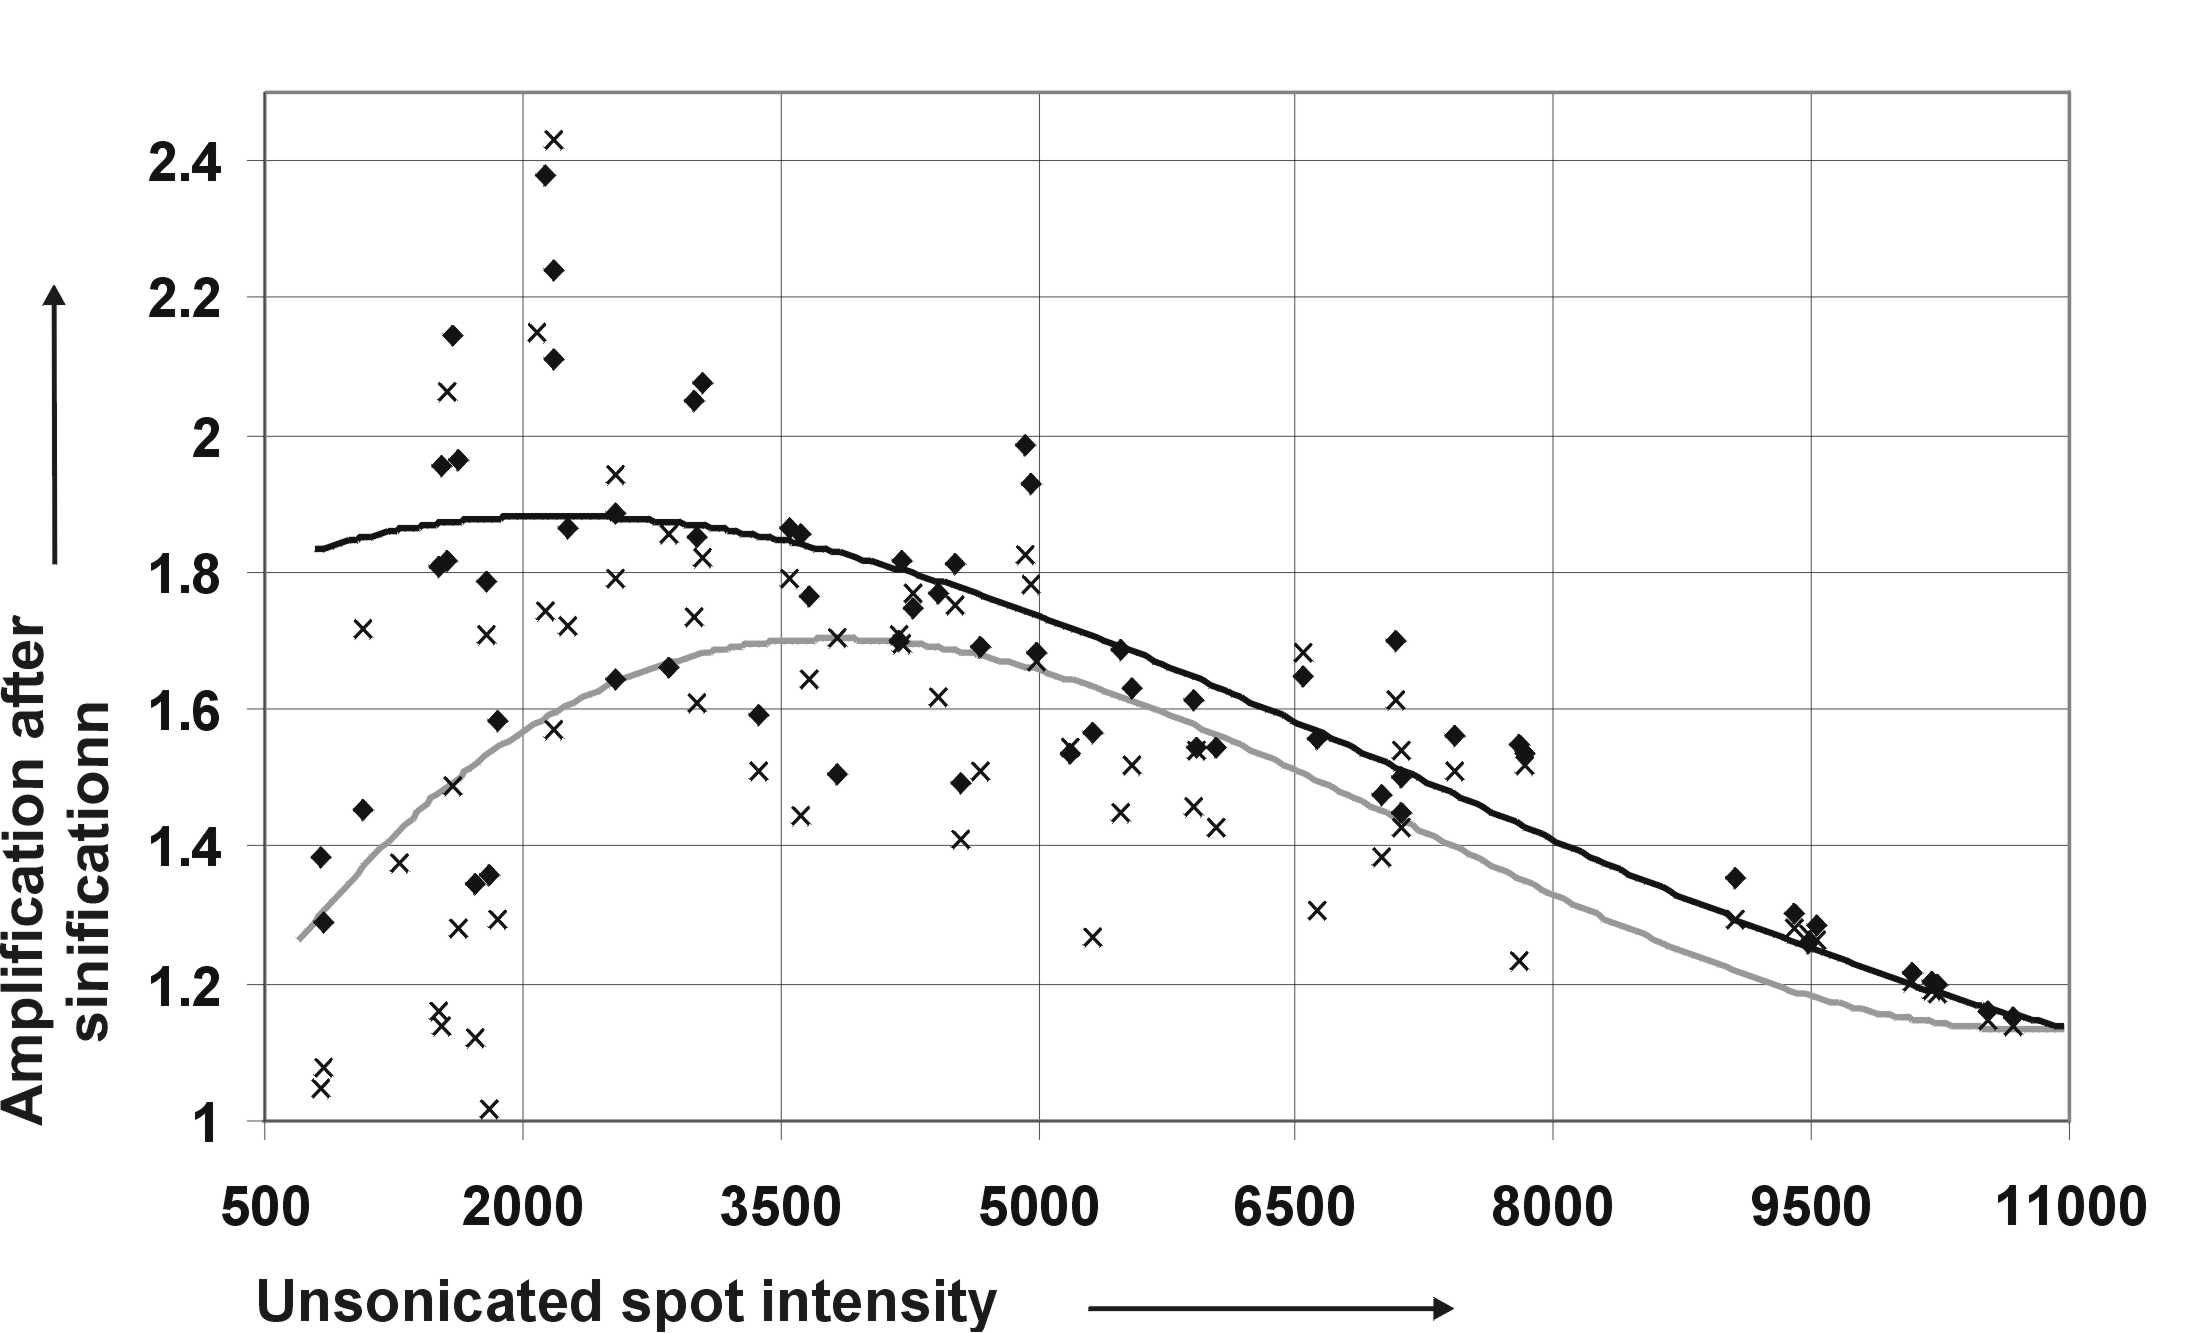
Figure 4
Click to enlarge. 80 mg of total human serum protein 30-60 kD and pI 4.7-5.5 containing 75 RuBPS stained spots. Panel A shows the original gel, Panel B the gel after 30 min. of sonication and Panel C after 60 min. of sonication. The background is distinctly reduced whereas spot intensities become visibly intensified from panel A to C.
|
|
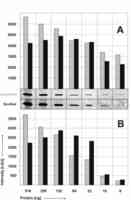
Figure 3
Click to enlarge. Two fold serial dilution of carbonic anhydrase beginning with 518 ng ending with to 8 ng with histogram plots of the spot intensities of before (grey bars) and after (black bars) sonication in panel A without background subtraction and in panel B with background subtraction. The gel was stained according to a speeded up RuBPS staining method.
|
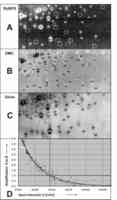
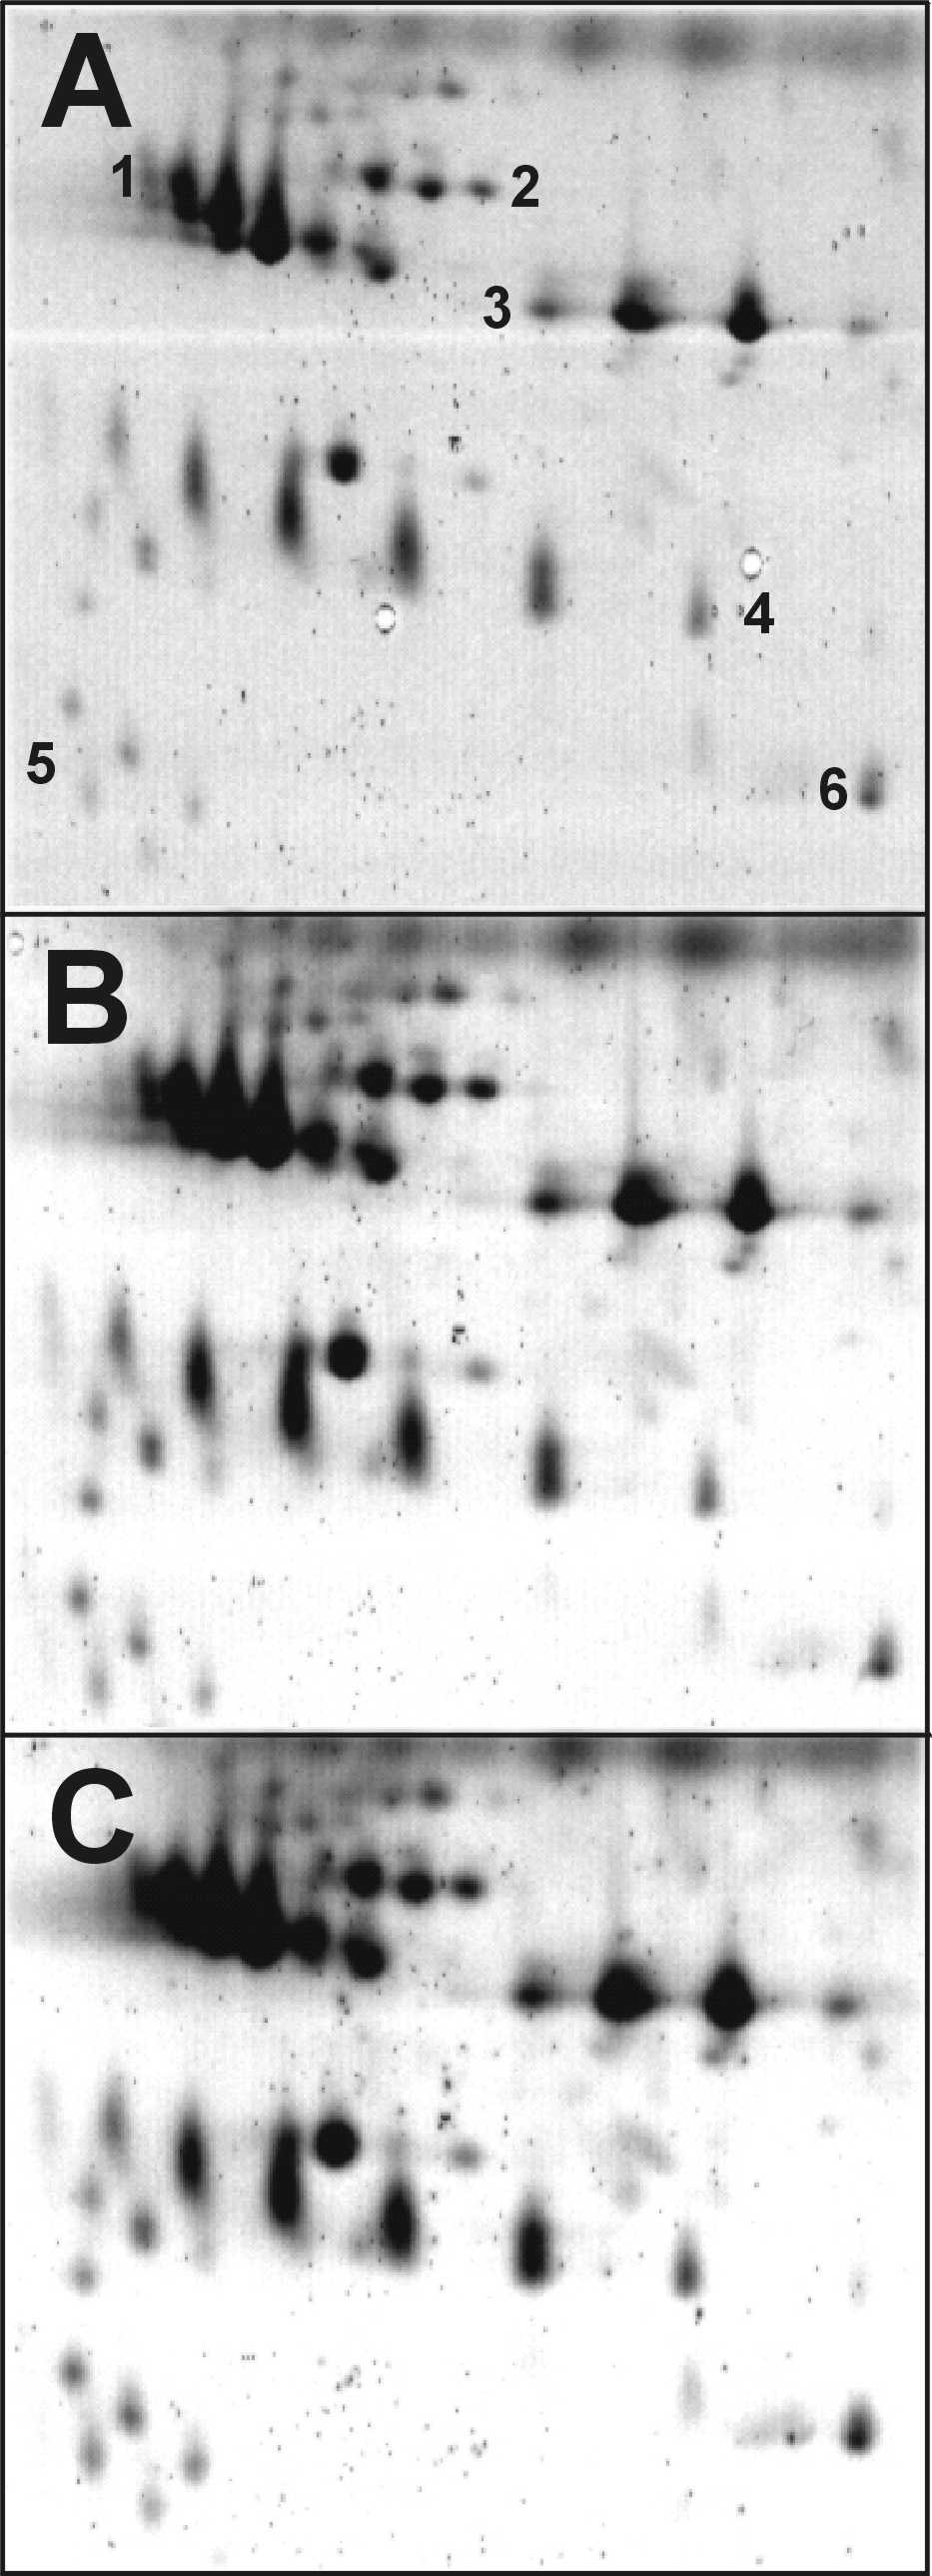
Figure 2
Click to enlarge. Gel region zoomed out of a 2-D gel containing 30 mg E.coli total cell protein from 10 to 25 kD and pH 5 to 5.6 is shown in panel A (RuBPS stained, 40 spots), panel B (RuBPS/DMC treated, 52 spots) and panel C (silver stained, 54 spots). Fluorescence is shown in white, quenching in black color. 14 spots marked by white circles were undetectable with RuBPS staining. 2 Spots marked by black circles in Panel B were undetectable by RuBPS/DMC treatment. RuBPS/DMC treatment detected almost the same amount of spots as silver staining. Panel shows a plot of the exponential decay function which links the spot intensities between RuBPS spot volumes (panel A) and RuBPS/DMC (panel B) spot volumes. White dots represent the background fluorescence.
|
|
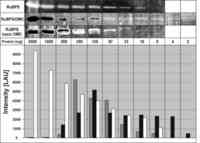
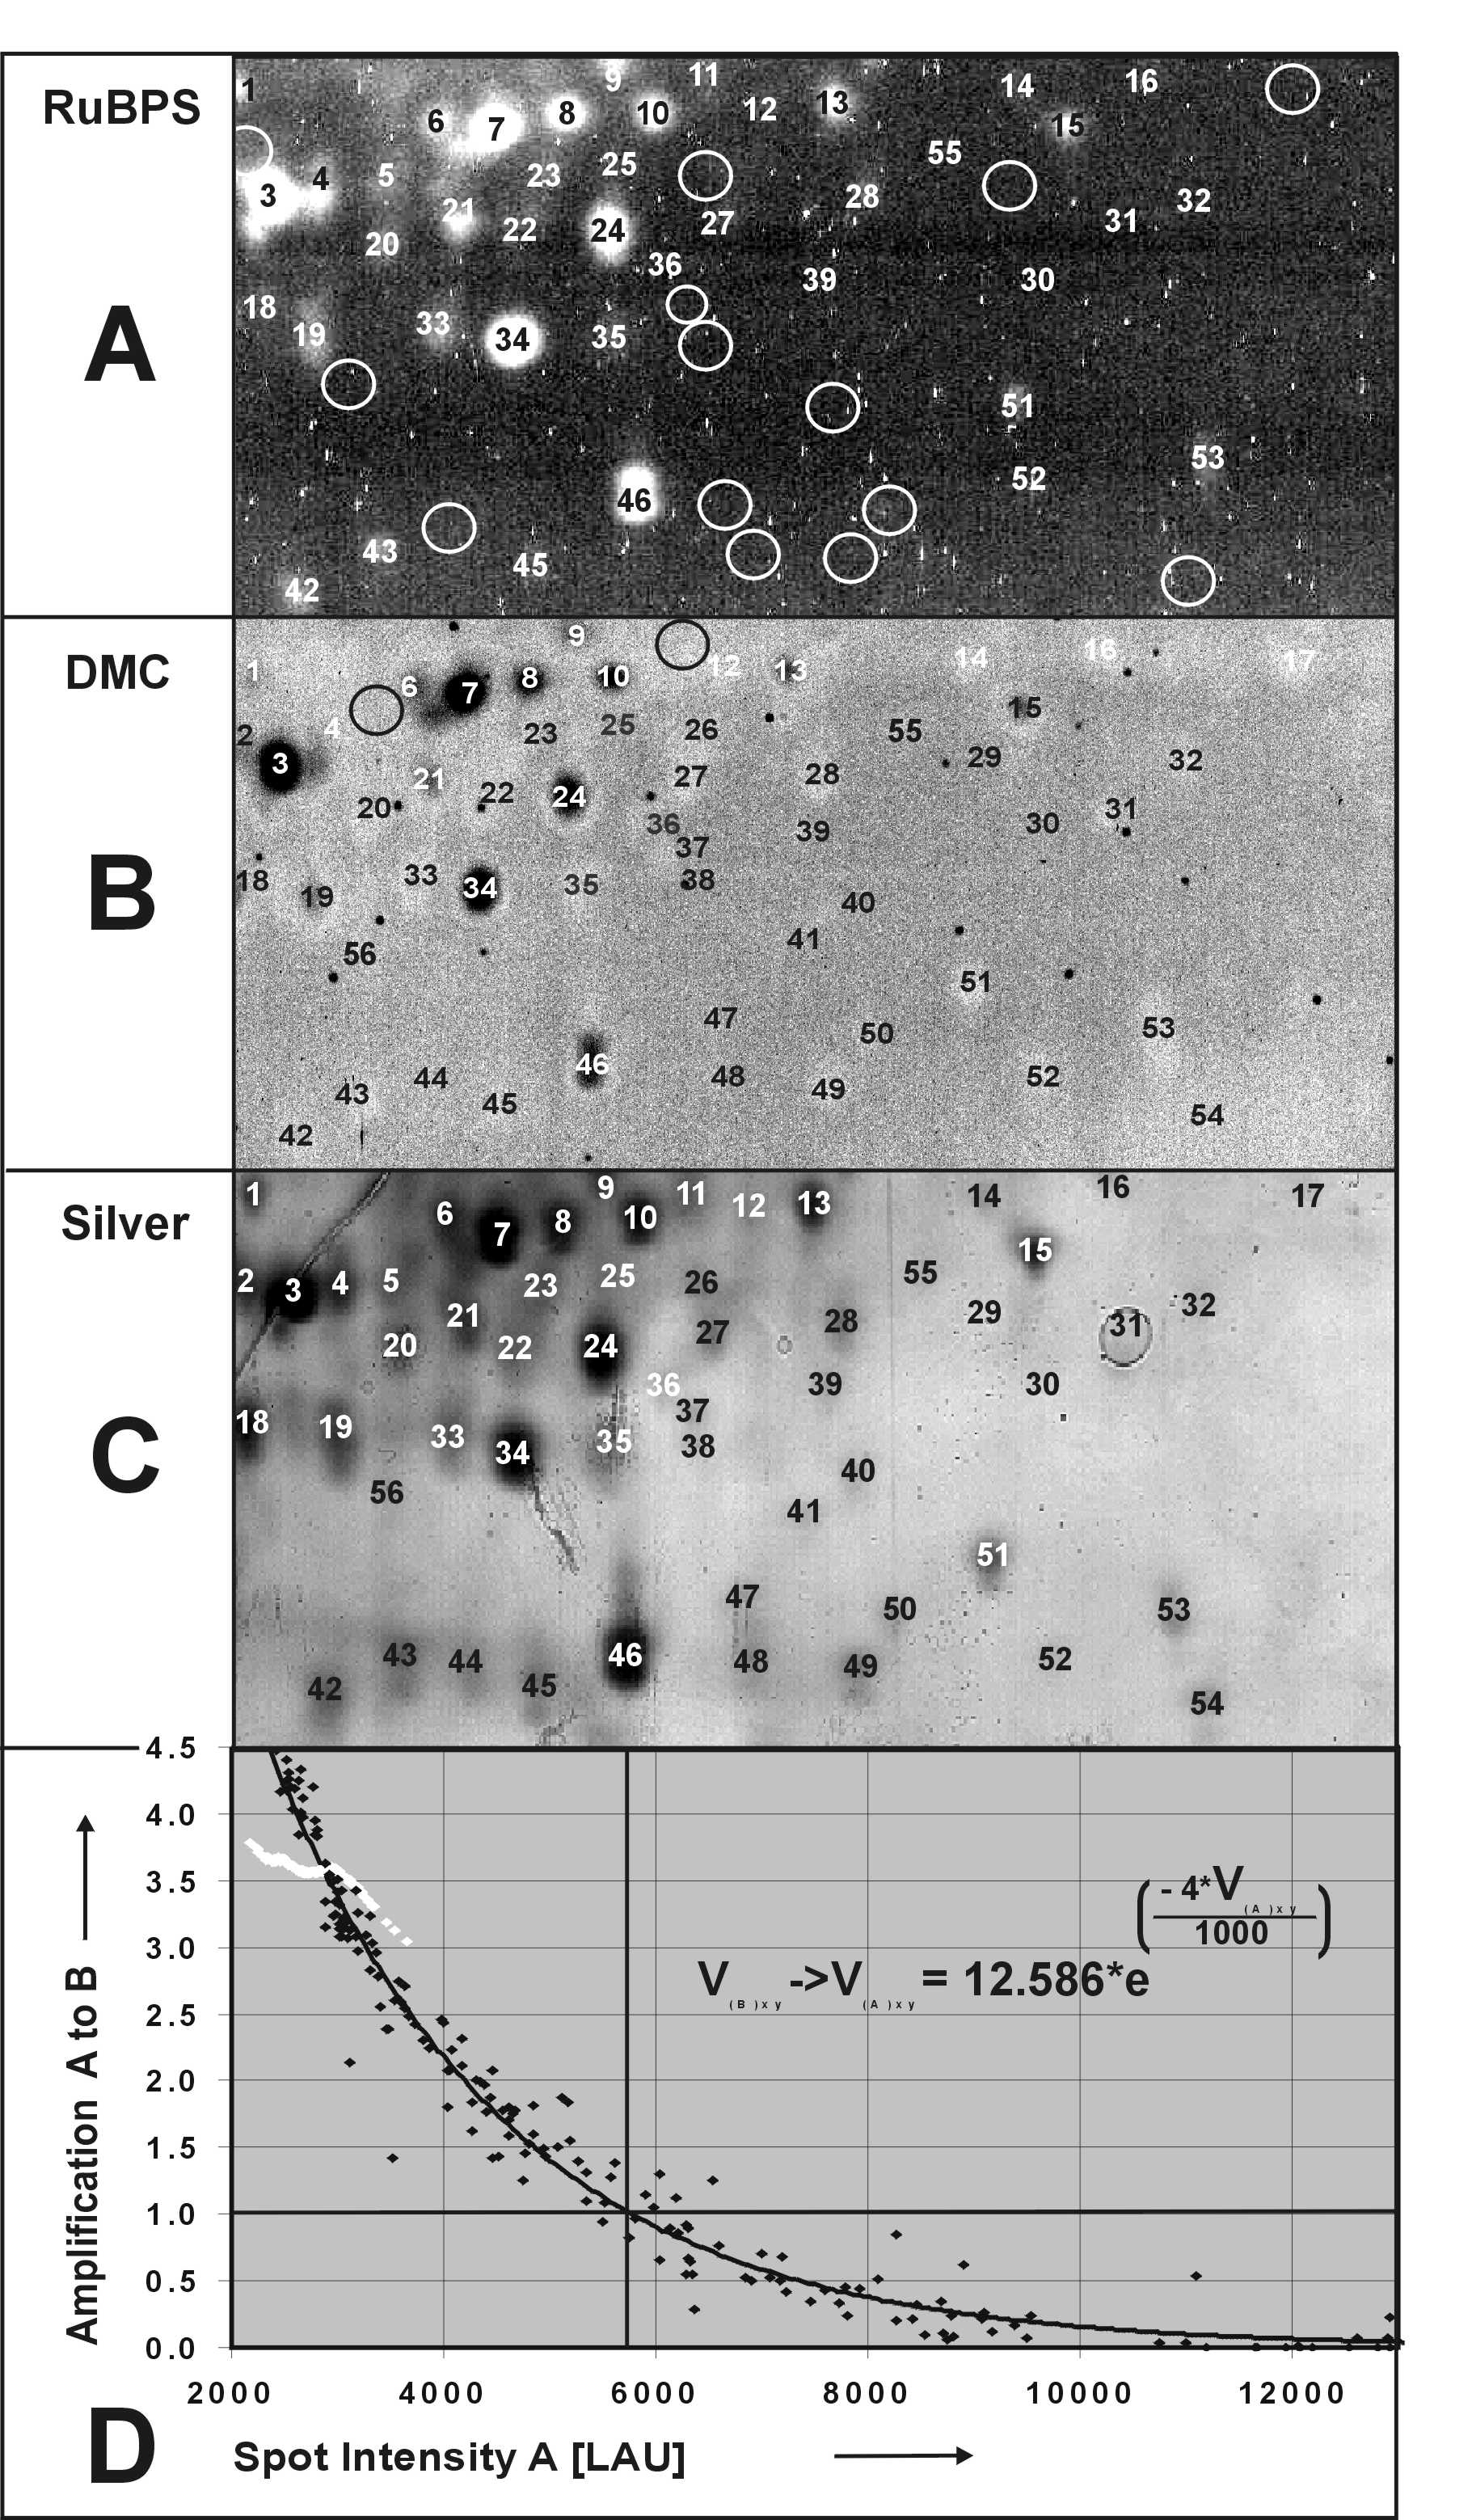
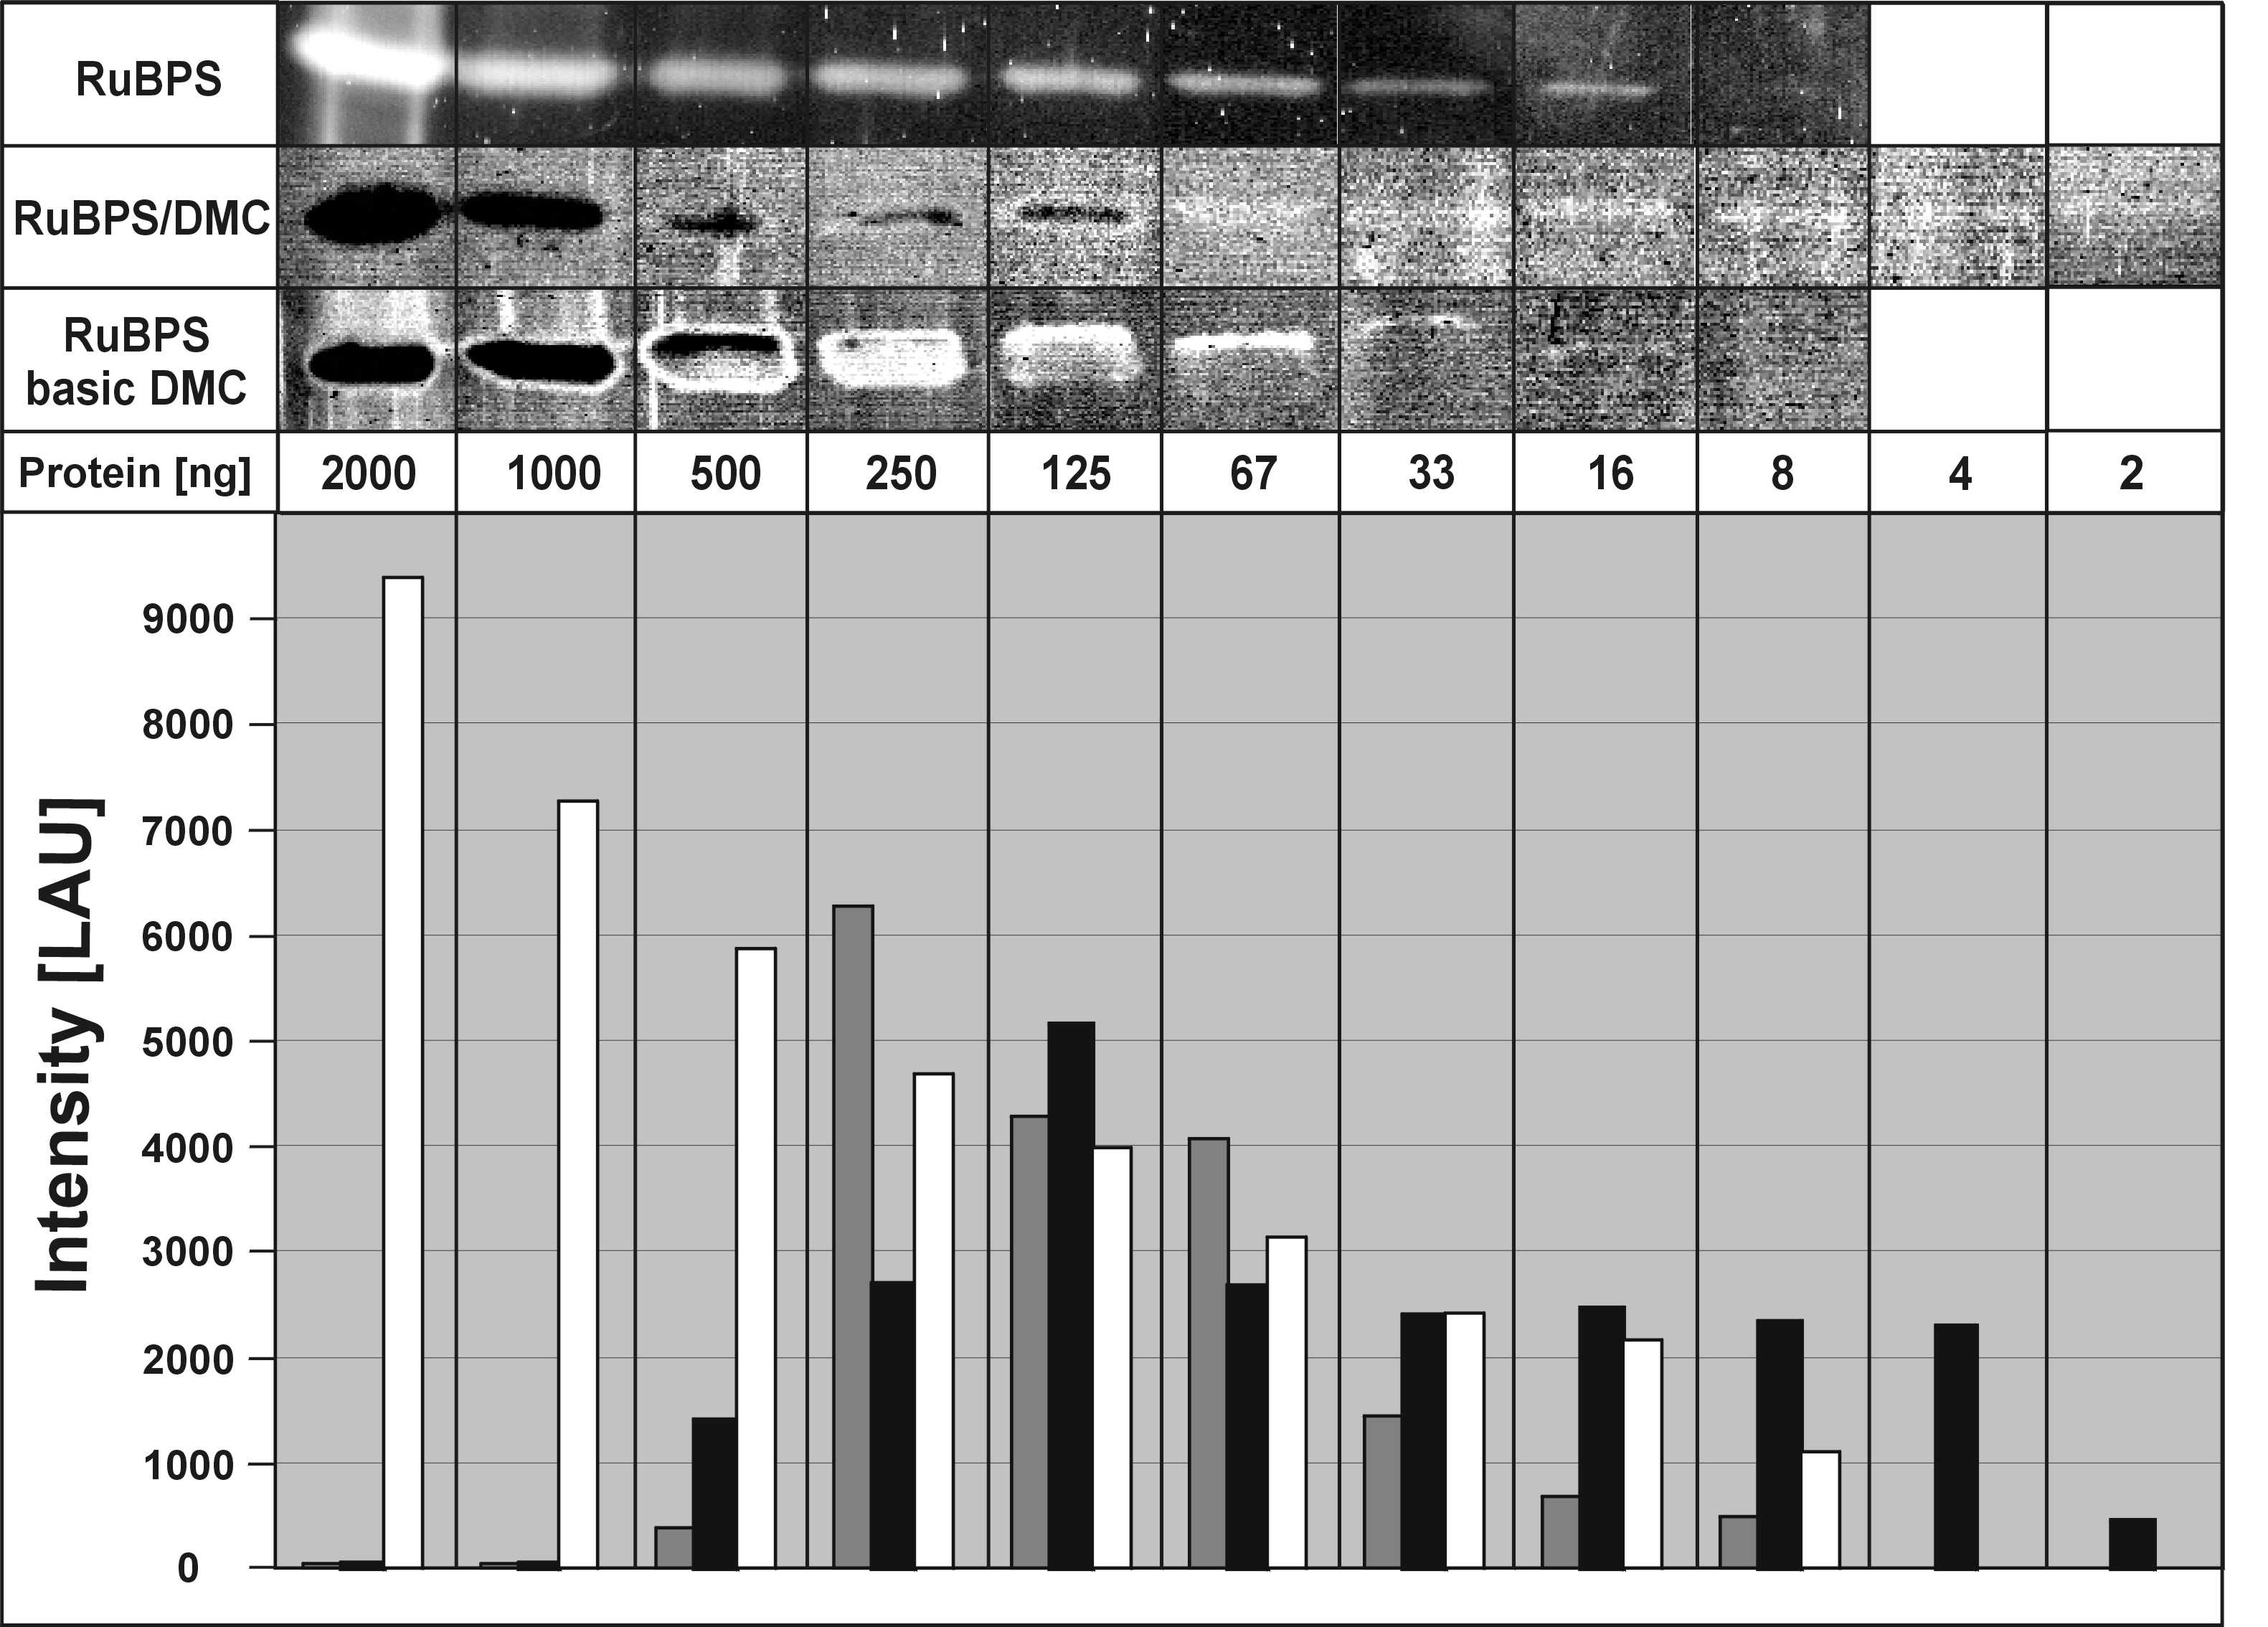
Figure 1
Click to enlarge. Gels snippets from the two fold serial dilution series of carbonic anhydrase beginning with 2 mg and ending with 2 ng per band are shown. The upper-most row shows the solely RuBPS treated gel pieces; the middle row, RuBPS/DMC treated; and the bottom row, basic RuBPS-DMC treated gel pieces. Fluorescence is shown in white, the background and also absence of fluorescence (quenching) in black color. Band intensities are shown below as histogram plot in LAU. White bars are for RuBPS band intensities, black bars for RuBPS/DMC and grey bars for basic RuBPS/DMC derived band intensities.
|