|
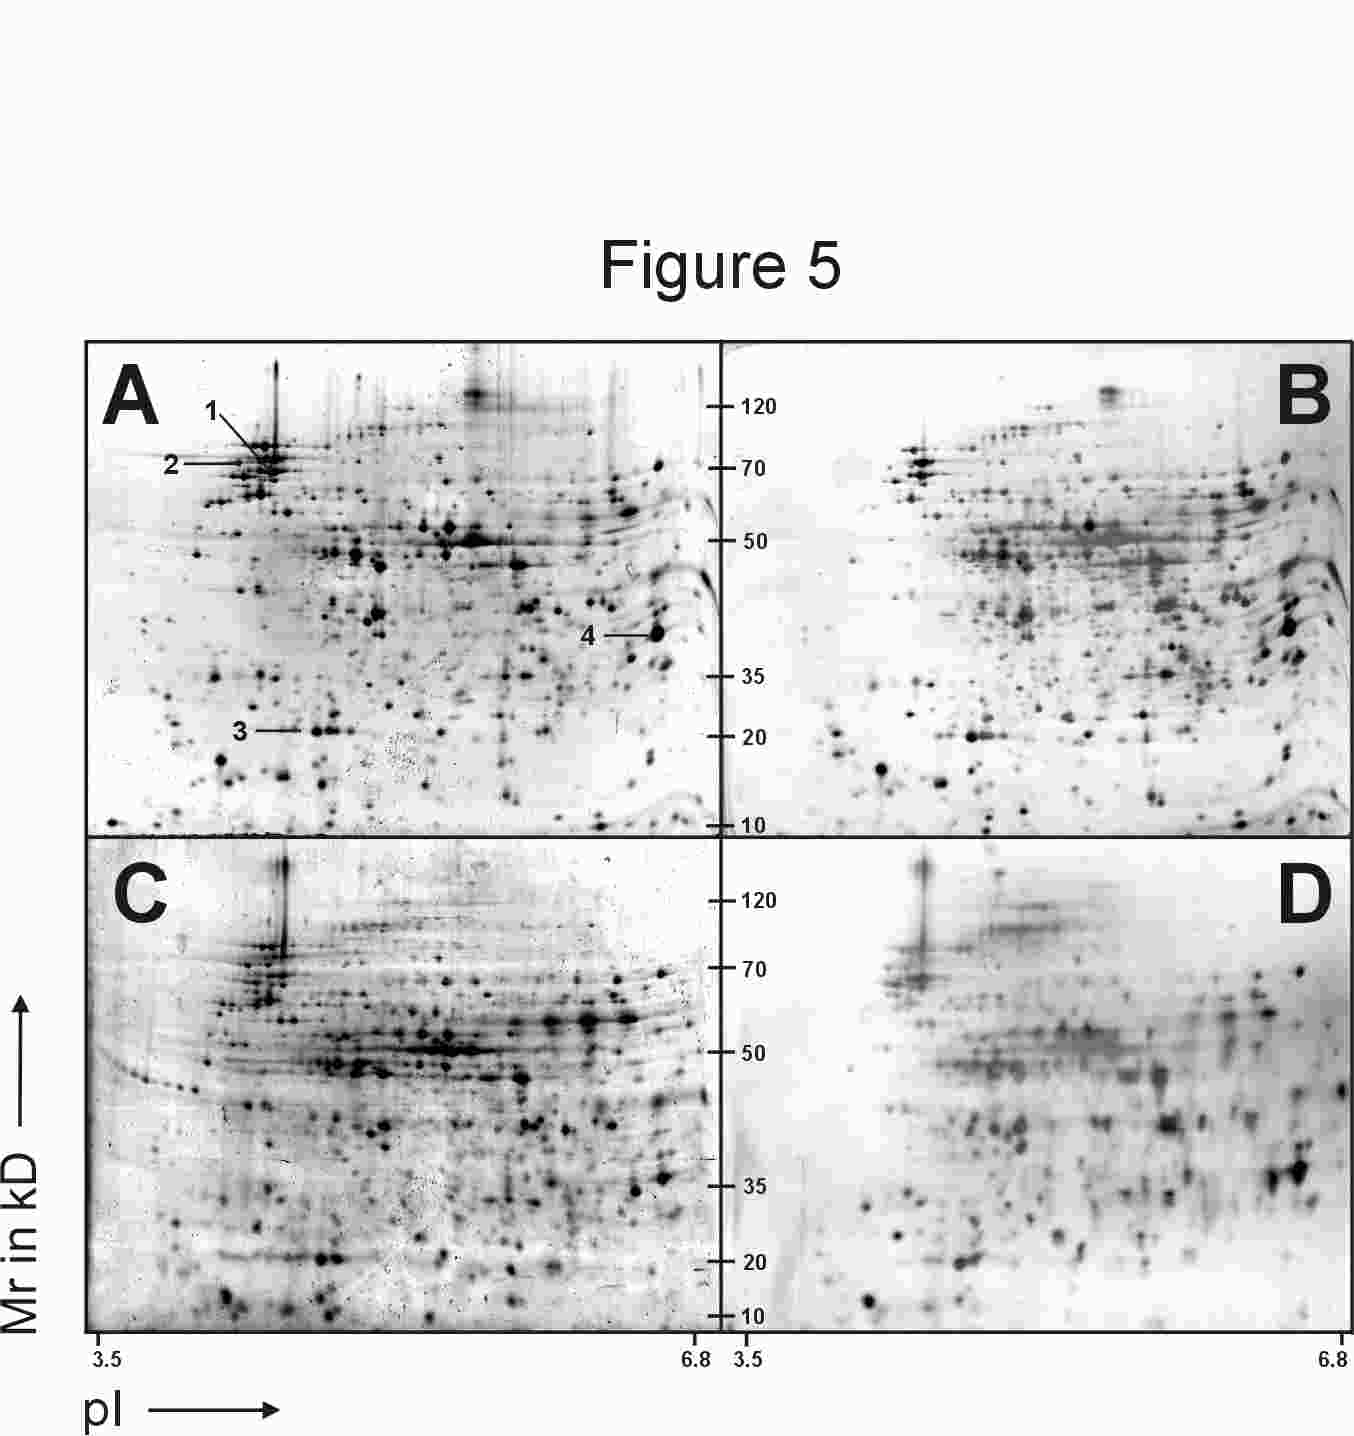
Figure 5
Electropherograms of E.coli whole cell extracts. RuBPS stained gel with 842 protein spots before (A) and 1064 protein spots after (B) silverstaining. SYPRO Ruby stained gel (C) with 574 protein spots before and (D) 479 protein spots after silver staining.
|
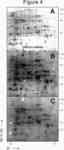
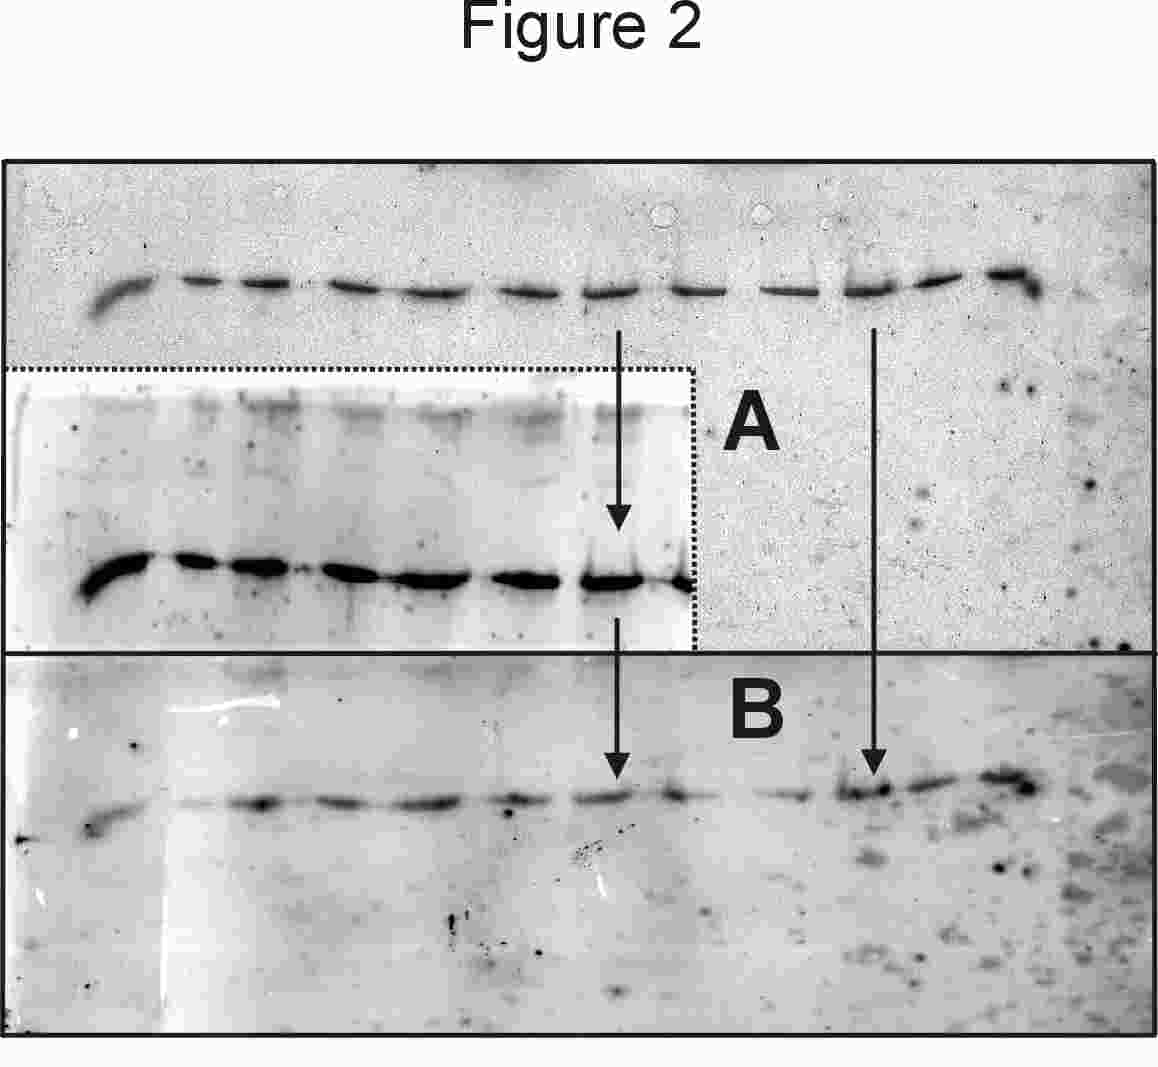
Figure 4
RuBPS stained 2-D gel with highlighted IIAGlc (A) before and (B) after electro-transfer with replication of the entire original spot pattern on the membrane. (C) shows membrane (B) after immunodetection with IIAGlc as a white spot.
|
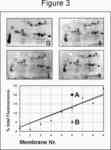
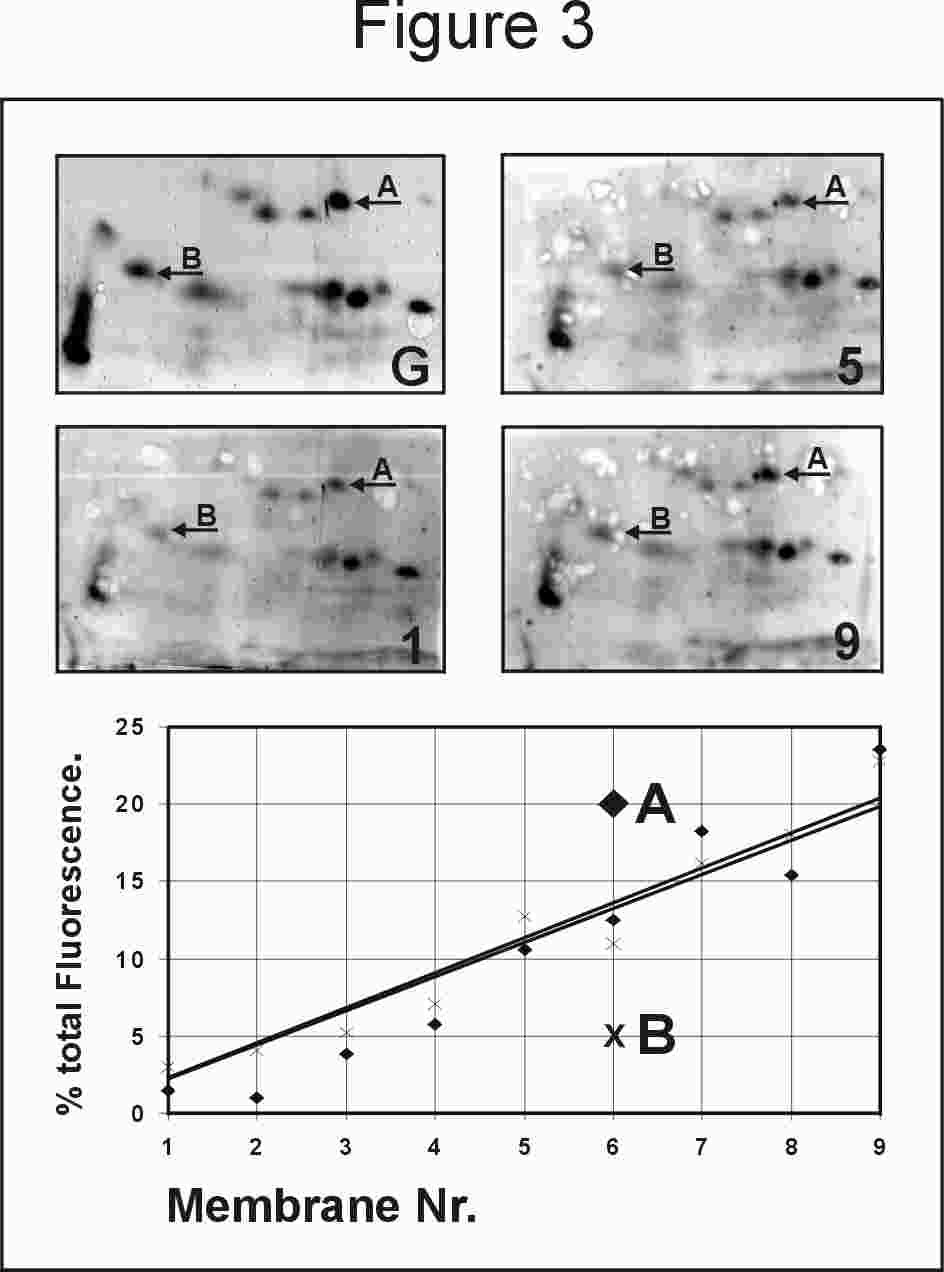
Figure 3
Transfer of 14 RuBPS pre-stained protein spots from gel up to 9 membranes (rat hypocampus sample). The gel (G) and membranes 1, 5 and 9 containing the 14 initially detected protein spots are shown. The plot of the percentage of total fluorescence against the membrane for spots A and B demonstrates the linear increase of fluorescence towards the higher membrane numbers.
|